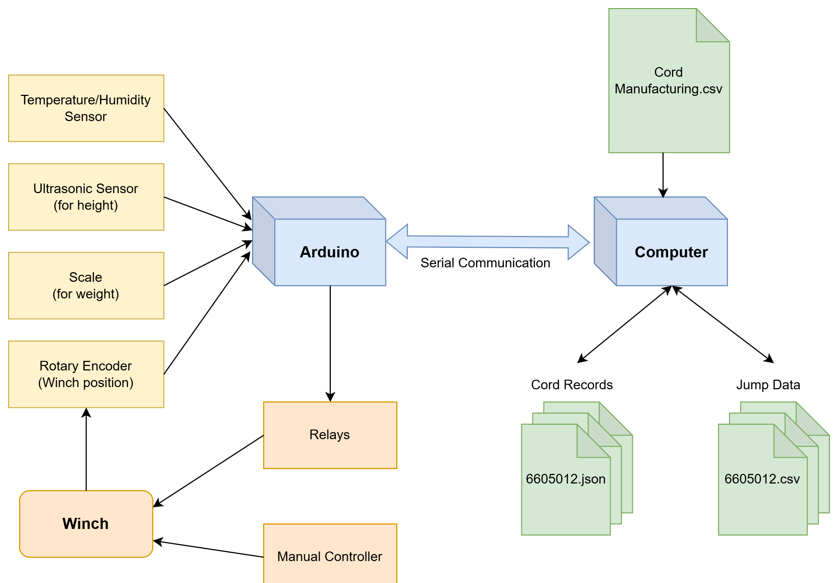
Smart Bungee Winch

Capstone Project Entry

My six-student team partnered with Great Canadian Bungee to automate water-dip bungee jump setup. The objective was to improve safety, consistency, and reduce setup time while keeping operators in control of the final decision. This page covers my contributions to the project.

What, Why, and Outcome

At Great Canadian Bungee, customers bungee jump from a platform into a water reservoir. The cord is setup such that they plunge into the water at a safe speed. Currently, operators manually select cord and anchor offset based on experience and manual calculations. This process can be time-consuming and variable. The goal was to build a sensor-assisted system that recommends cord and anchor offset, then controls winch positioning to achieve the desired jump profile. We built a prototype that achieves faster setup workflow with improved prediction quality and a strong proof-of-concept in physical tests.

Simplified diagram of the Great Canadian Bungee setup

Simplified setup diagram from the report introduction showing jumper, cord system, and water reference.

Key Terms

Anchor offset is the length of static line released beyond the anchor point before the jump. Changing this offset changes how far the jumper can descend.

Water height is the distance between the lowest point of the jumper and the water surface at first descent. A negative water height means the jumper has gone below the water surface.

Learning Journey: From Concept to Prototype

I started with historical jump sheets and built the model in iterations. I coded a time-stepping physics simulation to predict the jumper's trajectory. I could judge the quality of my model by comparing the predicted water height to actual recorded outcomes. Each version taught me what physics effects and practical constraints were missing, and each revision narrowed the gap between predicted and actual jump behavior.

Historical jump sheets used to build the data foundation

Data Foundation

Thousands of legacy jump records were transcribed and organized to support model fitting and validation.

Early closed-form simulation with high error

Iteration 1

Closed-form modeling exposed large prediction errors, showing that key real-world effects were missing.

Updated simulation with damping and drag

Iteration 2

Adding damping and drag improved behavior, but we still needed better per-cord calibration.

Final cord MAE table used to assess model performance

Final Model Fit

Least-squares fitting across cords produced the final MAE performance used in our validation phase. Cord aging effects were incorporated.

Final Prototype: Operator Experience

The final interface is built in Python using PySide6. Operators enter jump conditions, request a recommendation, view predicted trajectory, and confirm settings before jump execution.

The workflow intentionally keeps a human-in-the-loop checkpoint, balancing automation with practical operational trust.

Final operator interface showing inputs, recommendations, and trajectory

Final GUI main page used by operators to collect inputs, review model output, and run setup.

Engineering Perspective

Under the hood, the system combines a time-stepping physics simulation, fitted parameters per cord, and sensor-driven operational control.

System architecture block diagram showing sensors, Arduino, computer, and winch control path

System architecture used in the final prototype: sensors feed the Arduino, the desktop app computes recommendations, and control signals drive winch actuation.

System Architecture

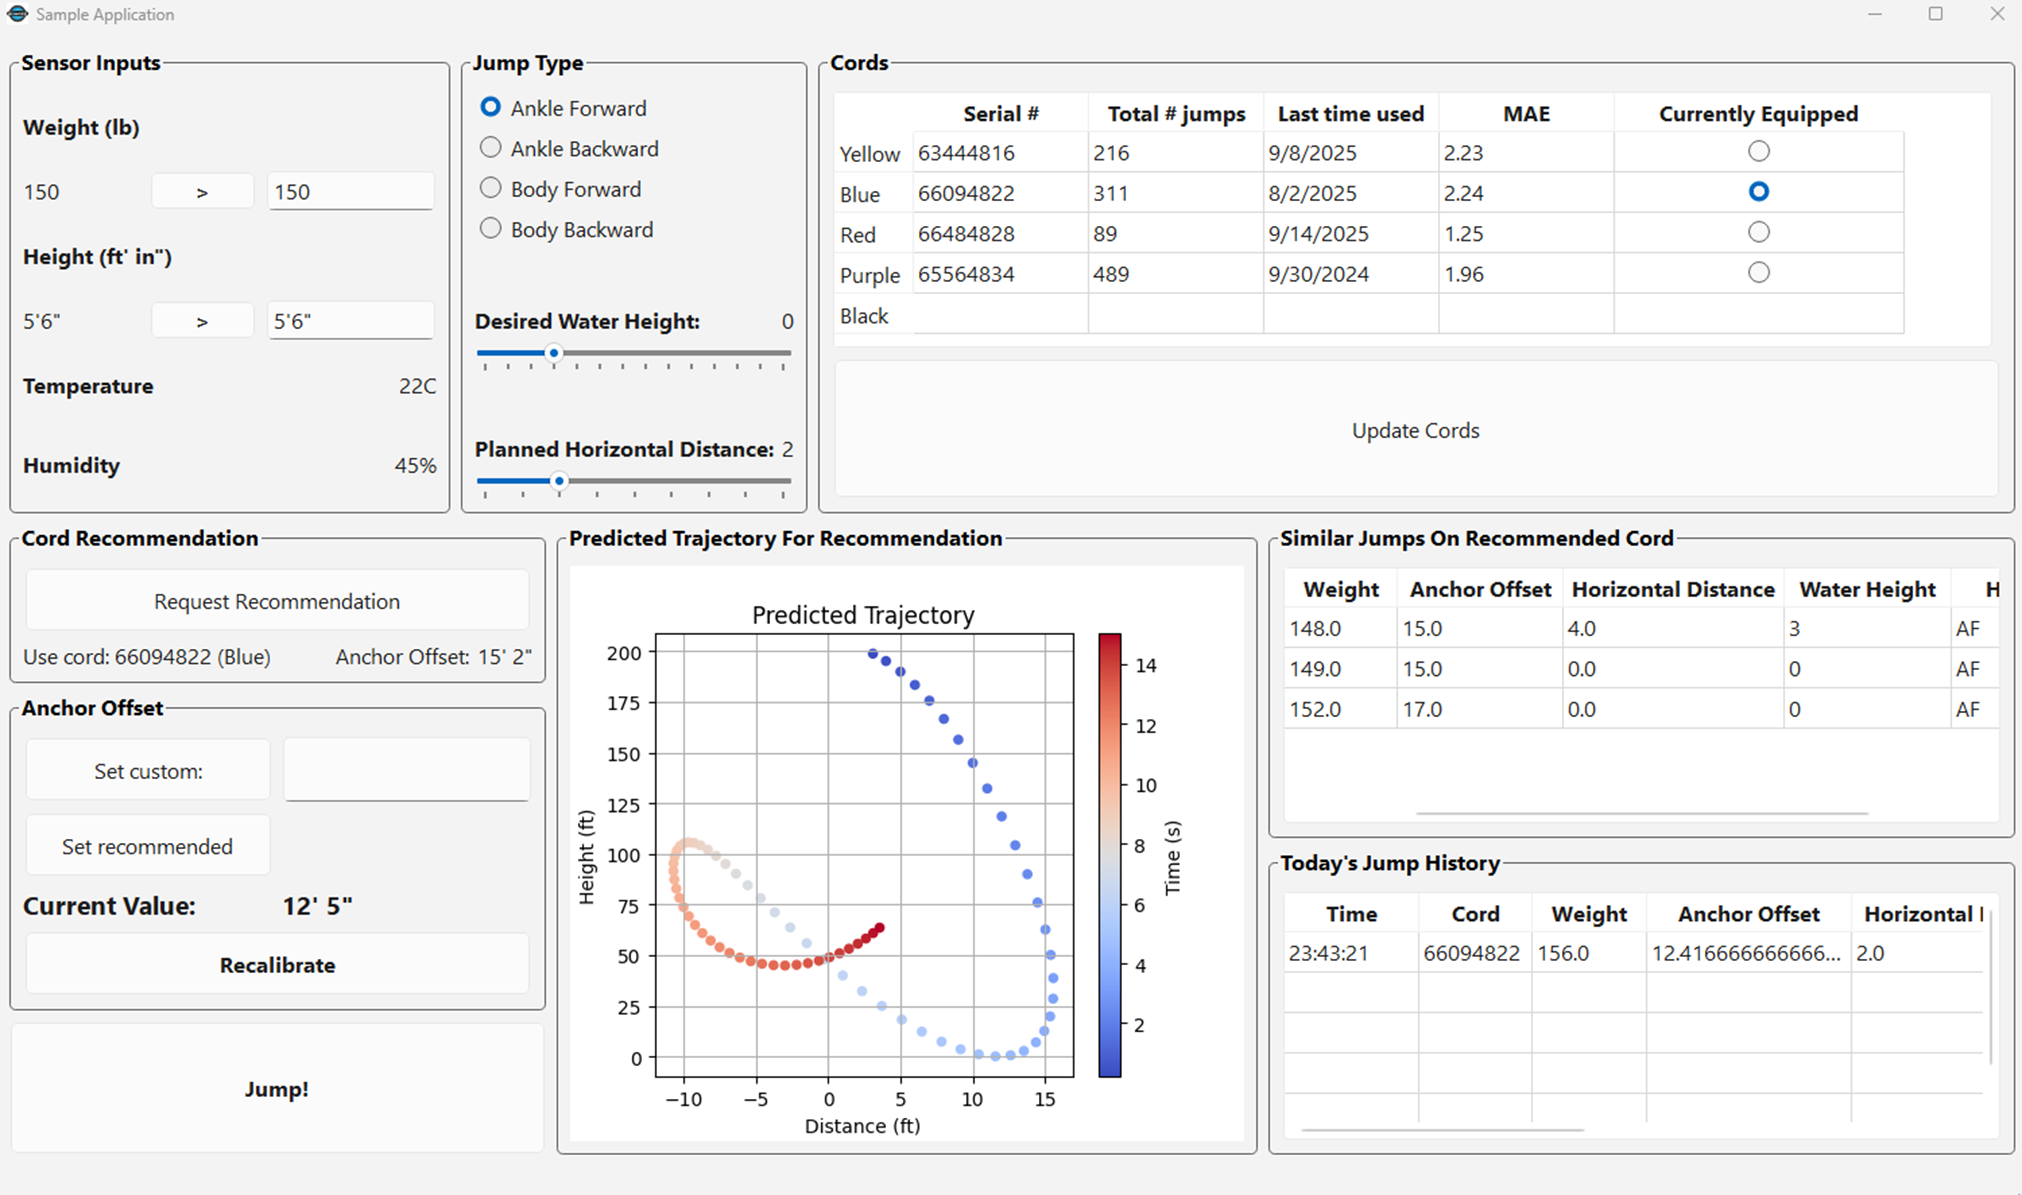
The architecture is built around a clear split of responsibilities. The desktop application handles simulation, recommendation, and operator-facing workflow, while the Arduino is used for real-time I/O, sensor sampling, and relay control.

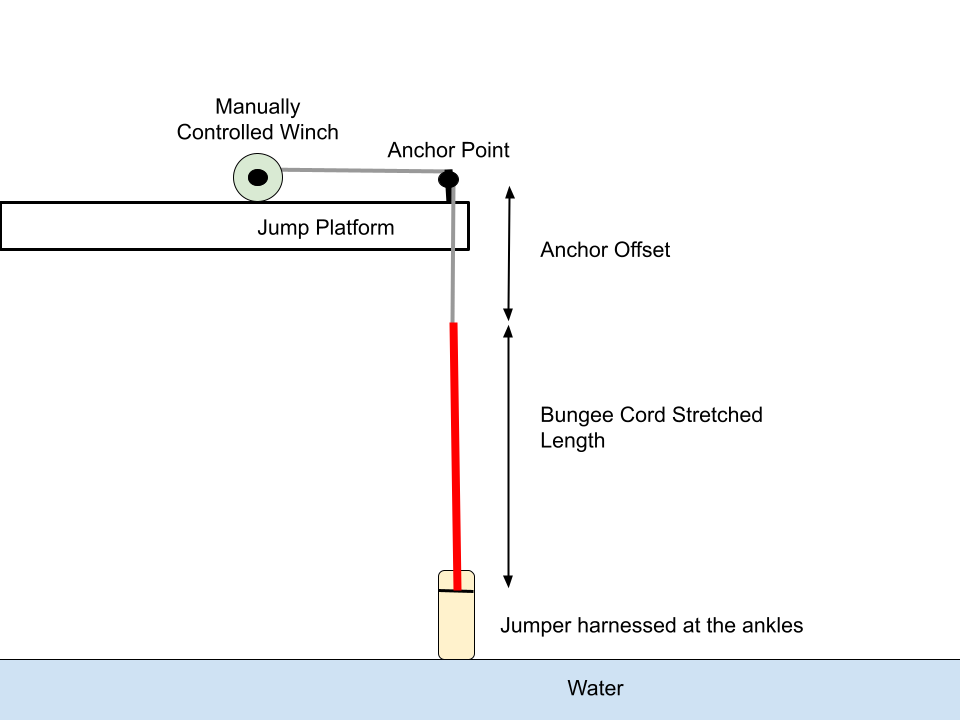
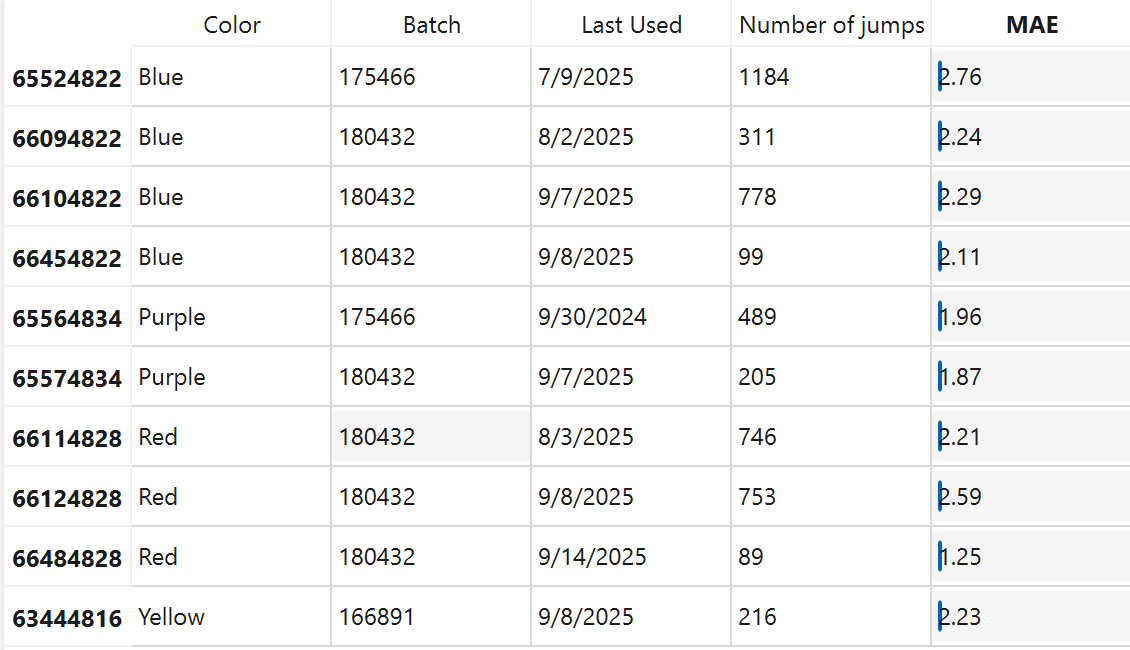
The system uses two connected file layers. Each cord has a JSON record that stores stable metadata and fitted model parameters, while each cord also has a CSV jump-history file that stores every completed jump event with measured outcomes.

During recommendation, the software first loads the relevant cord JSON records to get the current model parameters and service state, then references recent entries in the associated CSV history for context and operator sanity-checking. After a jump is completed, new measured results are appended to the CSV, and periodic refitting updates the corresponding JSON parameters so future recommendations reflect cord aging and real usage data.

Validation Results

I evaluated the final system using historical data by comparing the predicted water height to actual outcomes. This yielded a mean absolute error of about 2 ft, which is an improvement over the previous manual baseline. For fun, my team conducted a scaled physical test by throwing a 20kg bottle off a 20 foot bridge, and the system was off by only 6 inches. Finally, the setup time for the system was around 4.25 minutes, which meets our target of less than or equal to 5 minutes.

Real-world physical test setup for validating the Smart Bungee Winch prototype

Real-world test throwing a 20kg bottle off a 20 foot bridge

Software Accuracy

Target: plus/minus 1 ft
Result: about plus/minus 2 ft MAE

Scaled Physical Test

Target: plus/minus 1 ft
Result: about plus/minus 0.5 ft

Setup Time

Target: less than or equal to 5 min
Result: about 4.25 min

Overall, the final prototype met the speed target, achieved strong proof-of-concept physical accuracy, and improved on the previous manual baseline using historical records.

Read the full project reflection